Marketing Insights And Quality
Summary
Insights and quality close the loop between campaign execution and business interpretation. The goal is not just to count sends. Marketing needs exposure facts, response attribution, measure publication, lifecycle quality, serving snapshots, and operator-facing insight projections.
Reader Question
How does marketing turn runtime events and source events into measurable, quality-checked insight without letting analytics jobs own operational review state?
Surface Or Workflow
Operators enter through insights landing and detail pages. They inspect campaign response, responder geography, quality cards, attribution, lifecycle signals, and drilldowns. Engineers trace those views through analytics publication jobs and console insight services.
Lifecycle
Runtime emits deliveries, exposures, events, and action outcomes. Analytics jobs publish source events, measure facts, lifecycle facts, experiment facts, and serving snapshots. Quality validation checks whether facts are missing, stale, contradictory, or suspicious. Console services then assemble compact read models for the UI.
Child Threads
marketing-measure-publication-and-insights: measure facts and insight projections.marketing-lifecycle-quality-failures: lifecycle reconstruction and quality signals.marketing-pipeline-jobs: publication jobs and serving snapshots.marketing-outcome-to-geo-overlays: future aggregate H3 outcome feedback.
Implementation Boundaries
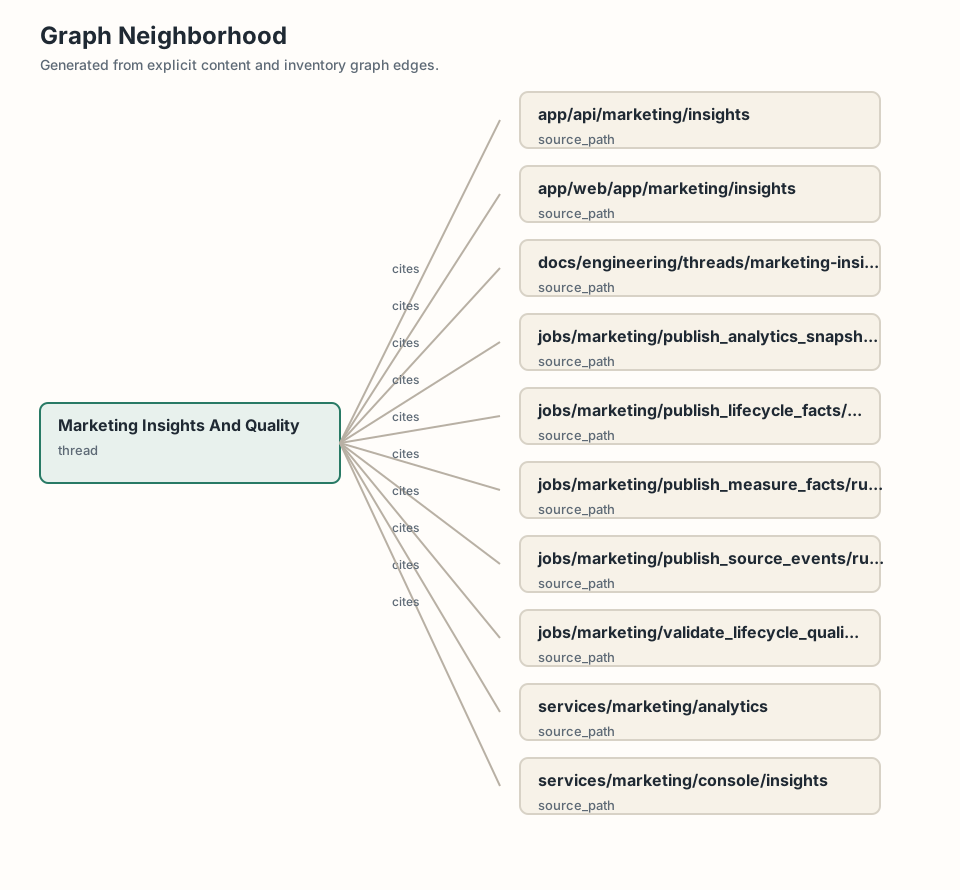
services/marketing/analytics owns publication and reconstruction logic. services/marketing/console/insights owns UI projections. app/api/marketing and app/web/app/marketing/insights expose the surface. Analytics jobs publish data products; they should not mutate review state except through explicit quality or issue boundaries.
Tradeoffs
Quality checks add latency and complexity, but they keep measurement from becoming a fragile dashboard. A campaign result should be explainable and debuggable before it drives future targeting.
Visual
The current visual is a graph neighborhood. The intended visual is a data lineage diagram from runtime events and source events to facts, quality checks, serving snapshots, insight UI, and future geo overlays.
Source Evidence
app/web/app/marketing/insightsapp/api/marketing/insightsservices/marketing/console/insightsservices/marketing/analyticsjobs/marketing/publish_source_events/run.pyjobs/marketing/publish_measure_facts/run.pyjobs/marketing/publish_lifecycle_facts/run.pyjobs/marketing/publish_analytics_snapshots/run.pyjobs/marketing/validate_lifecycle_quality/run.pytests/marketing